A successful Shopify store demands creativity and knowledge. Customers don’t just happen to become visitors. Professional teamwork and a thorough understanding of the products, customers, offers, strategies, and campaigns that produce the most remarkable results lead to high conversion rates.
A thorough understanding of business success has little to do with speculation. It originates from several Shopify reports. You can accomplish a sizable boost in sales when your knowledge is supported by reliable statistics on every area of running an online store. Even better, you can plan it.
You can get an overview of key performance indicators with Shopify reporting, such as where your customers come from, how they shop, and what they think of your assortment, as well as information on your revenue, net profit, and rate of repeat purchases. You can also see which products are selling and who is buying them. Shopify’s professional reports are essential for the development of your company since they enable you to identify issues and opportunities quickly.
Agree? Continue reading to discover how to leverage Shopify store reports to boost sales.
What we’ll discuss in this blog article is as follows:
Effective Shopify Reports to Boost Sales
Because modern systems are so intelligent, even default reporting settings can present so much information that it’s simple to become lost. You must understand which Shopify reports are absolutely necessary for your company and which ones can be skipped, such as the Shopify inventory report, Shopify payout report, Shopify abandoned cart report, Shopify fees report, Shopify shipping report, Shopify returns report, Shopify conversion rate report, Shopify refund report, Shopify product sales report, etc.
Shopify’s Store Dashboard
The Shopify dashboard overview is the first set of reports you should look at every day. We strongly advise using this daily to quickly keep tabs on the activity in your Shopify business, your sales, and your clientele.
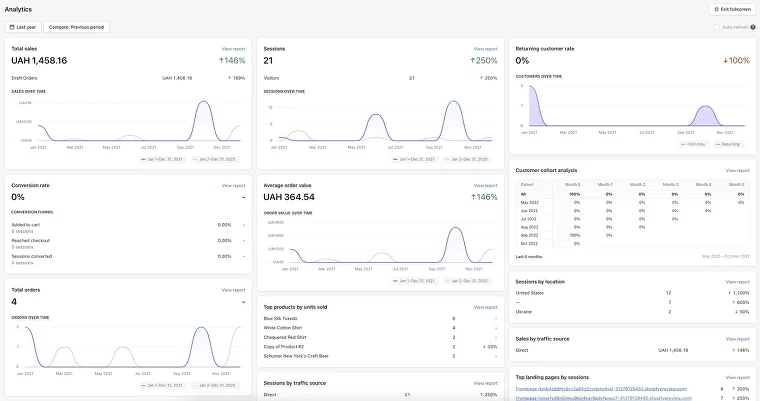
It is the ideal tool for Shopify analytics every day. You get a complete picture of your products and sales funnel, including information on sales, conversions, orders, traffic and sessions, and visitors.
In other words, you can track the effectiveness of your online store across all sales channels using the dashboard overview. The data can also be used to forecast revenue growth and compare historical periods.
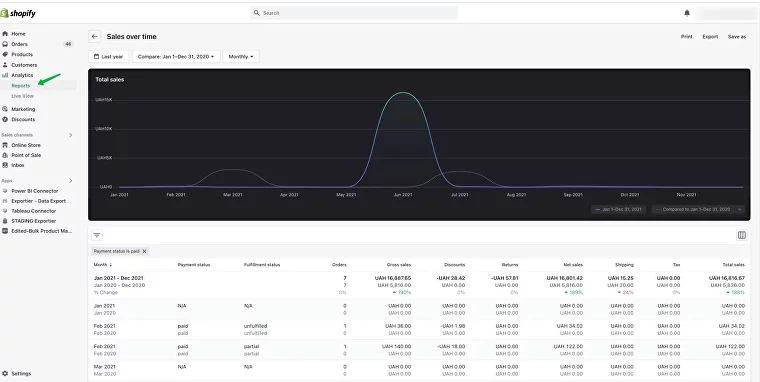
Shopify Sales Statistics
Shopify sales reports make up the next substantial segment. It gives you useful information about sales and products that enlightens you about customer purchasing patterns. Those conclusions are based on requirements or standards that apply to you.
Shopify provides numerous built-in Shopify sales reports, such as:
- Sales trends,
- Sales by product,
- Average order value changes over time,
- Sales by discount, and many more.
Reviewing the orders placed during a specific month, day, or week can enable you to identify seasonal sales trends and adjust your promotional efforts as necessary.
Additionally, you can monitor your sales based on:
- Marketing initiatives,
- Billing regions,
- Client information, etc.
Your strategic choices (new store launch, target market) will be better informed with the help of these reports.
Added sales reports include:
- Sales by product,
- Sales by client name
- sales by channel or traffic referrer.
You may learn more from these reports, including which websites get you the most visitors, and which channels and countries generate the highest revenue. With the use of this information, you may more effectively plan inventory, invest in new markets, run future advertising campaigns, and more.
Additionally, bespoke Shopify reports that let you apply the necessary filters or just display the data you require can be used to customise Shopify sales reports.
Otherwise, you can always create the required Shopify report outside of Shopify, for example, using Excel or other tools that you are skilled with, if your reporting requirement from Shopify is more specialised or complex. To extract the data from your store, you simply need an appropriate Shopify data export tool. The Shopify App Store has solutions available. For instance, you can use the Exporter – Data Export app to plan the export of Shopify data like goods, orders, or customers to CSV or Excel.
Reports on Shopify products
You may examine your purchases and returns using the Shopify products reports group.
You can monitor products that your customers return more frequently or never return, for example, or you can monitor order dynamics.
Reports for Shopify items provide statistics on fulfilment, such as:
- Fulfilment over time;
- Fulfilment, shipping, and delivery times.
You can use various criteria to build personalised Shopify reports that you can export as spreadsheets or print as necessary.
Shopify Analytics BI Tools
Sadly, having access to raw data still allows the possibility for incorrect conclusions, missing dangerous trends, and potential sales declines. It’s horrible when you have little data, but it’s confounding when you have a lot of it. For this reason, a lot of retailers integrate business intelligence programs like Google Data Studio, Tableau, and Microsoft Power BI with their Shopify projects.
Applying BI tools is highly advised if you have trouble increasing sales. Your growth-based indicators will be highlighted in easy, illuminating eCommerce analytics dashboards that they will design. Data analysis is great because it allows you to distinguish between important metrics and flimsy ones. You also receive guidelines and directions in addition to information.
The Shopify platform has many paid and unpaid analytics solutions. Your decision will be influenced by the function for which you need the tool and the outcomes you hope to achieve. Each BI app has advantages and disadvantages.
The following are some of the key variables that retailers wish to track in real time:
- Visitor counts,
- revenues,
- orders,
- conversion,
- bounce rates,
- order abandonment, etc.
The most popular choices to meet these requirements are Google Data Studio as a free option, Microsoft Power BI, and Tableau. Everything depends on your budget, though, such kind of investment is likely to pay off very soon.
In case you decide to use Power BI or Tableau for your Shopify reporting needs, the quickest and easiest way to add your e-store to data sources for analysis is to use a connector specifically developed for the purpose.
Tableau Connector
Power BI Connector
After linking your Shopify data to the selected Business Intelligence app, you can start visualizing actionable insights straight away.
How to Increase Sales on Shopify Using Data from Shopify Reports
How can Shopify sales be increased? How can I increase Shopify sales? The Shopify store owners and sales teams ask these questions the most frequently. The Shopify reports mentioned above provide crucial information that might serve as a hint to find the solutions.
Depending on the results you see on the Shopify reports, below are just a few suggestions for how to boost sales on Shopify:
- Intelligently manage your pricing and take advantage of sales to stay competitive;
- To raise your average bill and client satisfaction, always provide appropriate products and freebies (such as batteries for a toy or protective glass for a new iPhone);
- Review inventory to ensure that the best products are in stock and that old items are promptly disposed of;
- Add new products to your inventory to keep it fresh and attract new customers;
- Segment your audience and create targeted offers via email and advertising campaigns;
- Get ready for every seasonal and holiday sale well in advance;
- To increase visitors, periodically update your SEO characteristics and product description.
Conclusion
The sales increase is one of the ultimate goals for every eCommerce project. A rare modern business will rely on luck, most will track all possible data and metrics to make sales and marketing campaigns more resultative. Sounds like a challenging task but modern technologies let you get all-embracing reports as easy-peasy one-pagers. When all the context you need for a strategic decision is so visual and understandable, running a profitable Shopify store becomes a walk in the park.
Check this out yourself, connect your e-shop with Power BI or Tableau and start to enjoy effortless analytics together with improved store performance.