Today, BI and analytics go beyond figure crunching to give business insights, including every facet of an analytics user’s experience. Users now seek more consumerised experiences when interacting with data and insights in this environment. The emergence of creative communication fueled by data storytelling results from this.
This blog post will discuss a data storytelling methodology to help BI users create compelling data narratives. We’ll also look at a few essential data storytelling tools that can assist BI users in contextualising and evoking empathy when presenting their findings.
4 cornerstones of Powerful Data Storytelling
These four pillars provide an overview of the four characteristics of effective data storytelling that BI users may utilise to create appealing data tales to enhance decision-making. We’ll delve deeply into these 4 pillars—self-service, live & interactive, creative, and data governance—in the next section.
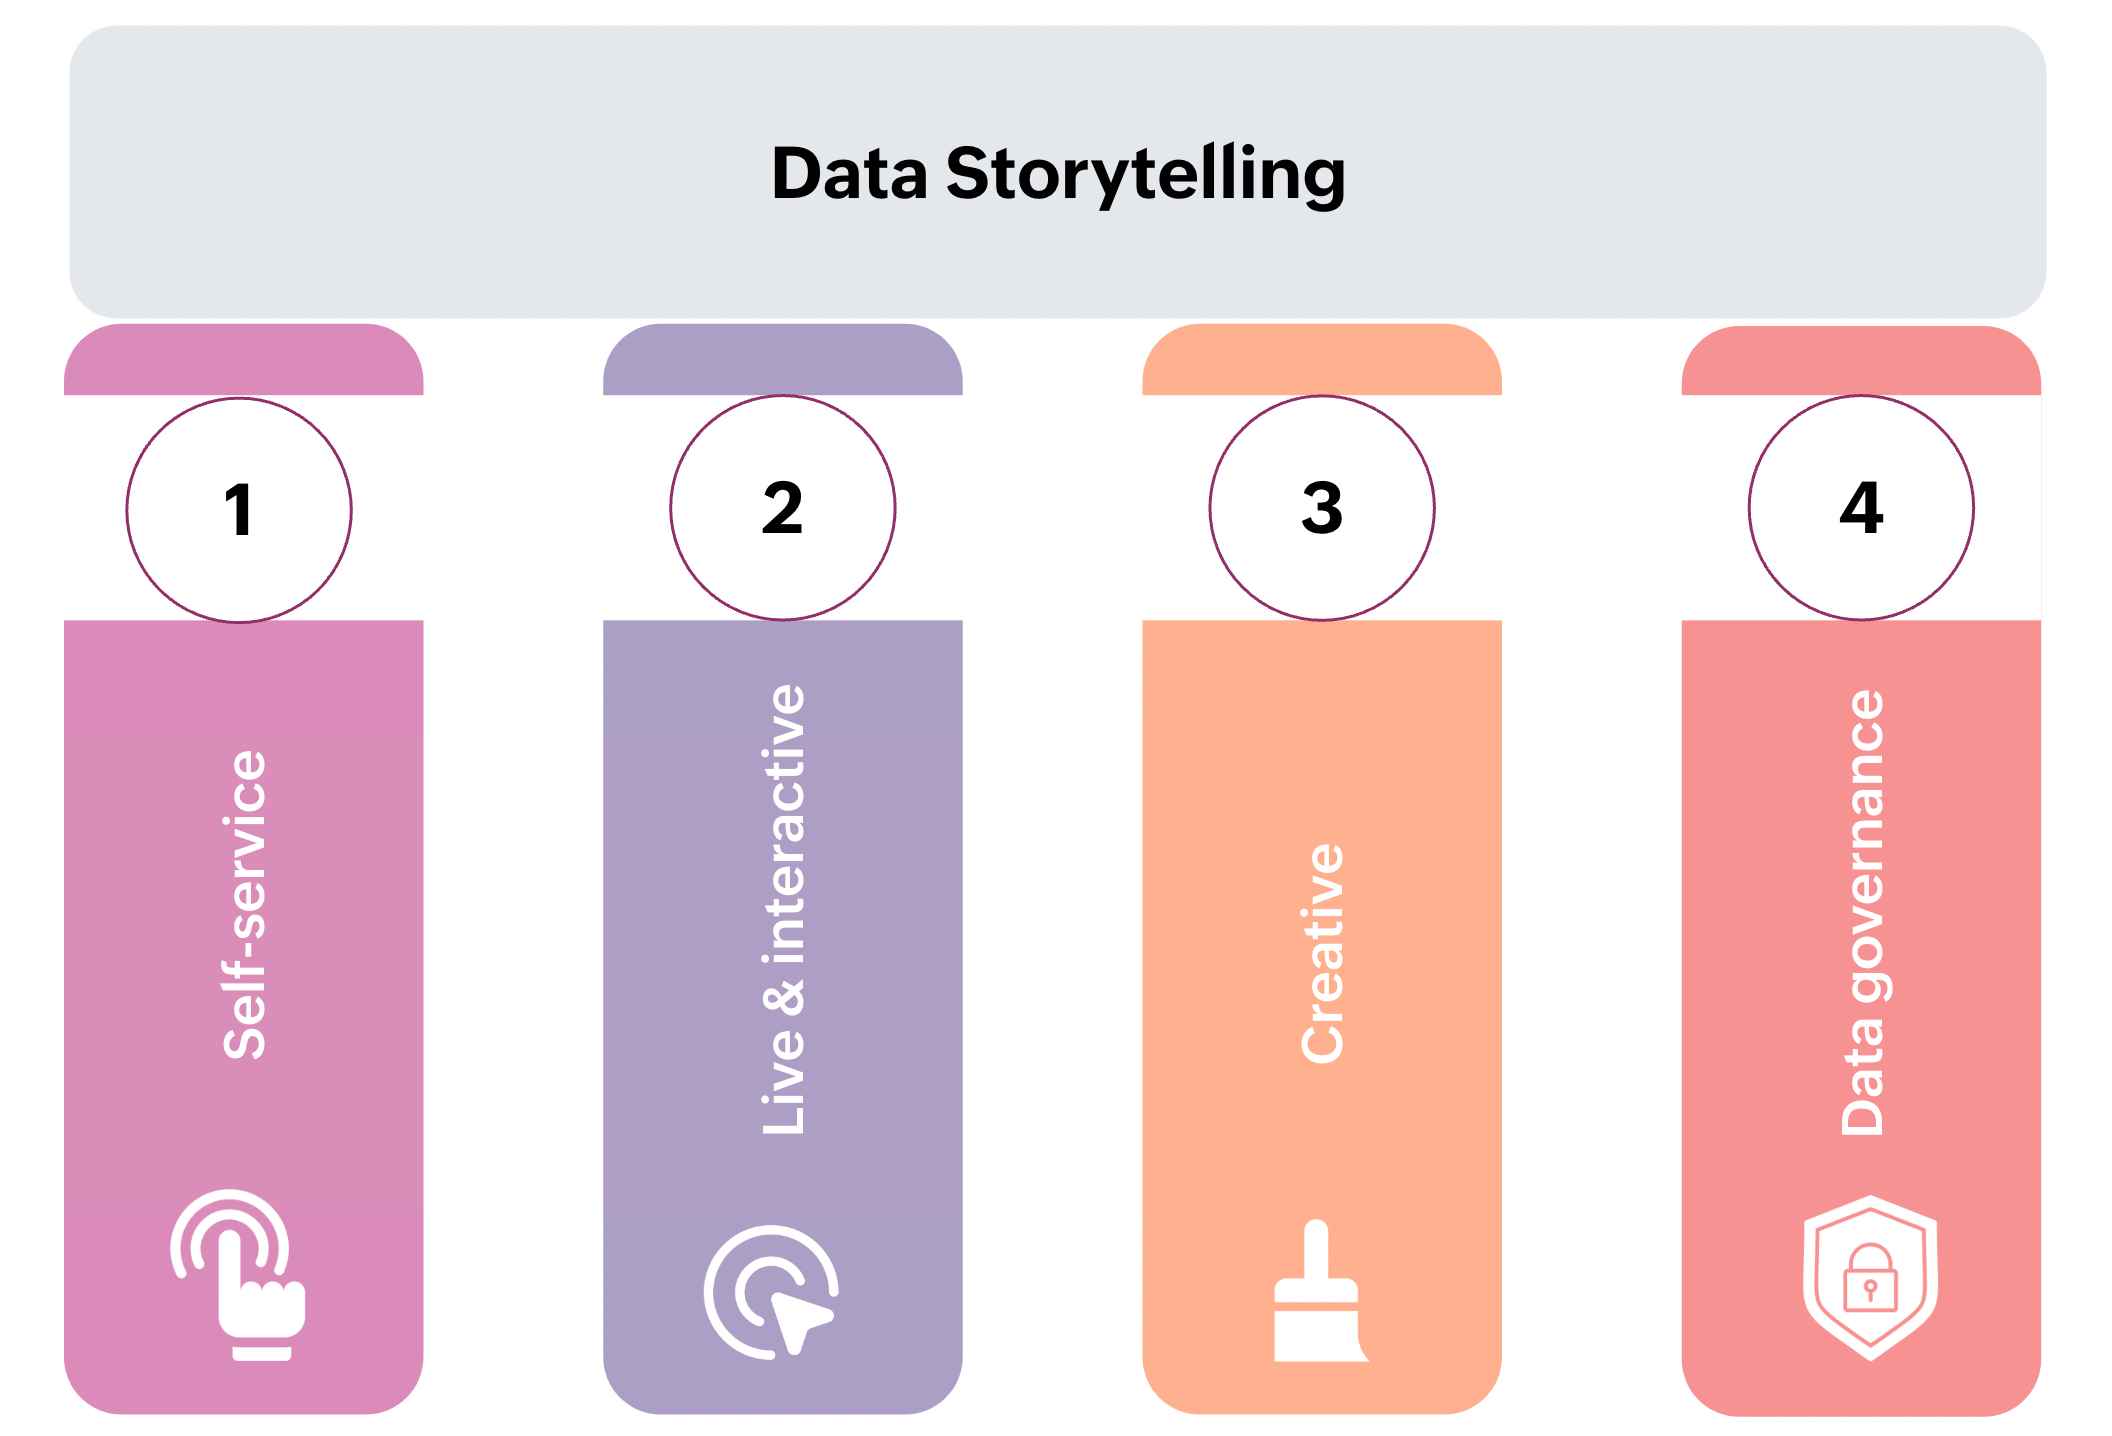
1) Self-serve
Self-service refers to enabling BI users to independently create and share insights in the form of engaging data stories. The decision-making process is accelerated as a result. Platforms with low-code/no-code capabilities are one approach to do this.
2) Interactive and live
Traditional static reports’ rigidity prevents users from freely interacting with data insights, accessing up-to-date information, and performing ad hoc analysis. Live and interactive data stories that make sure the insights are constantly updated can help with these problems. Using dynamic dig downs, filters, and other tools, users are also free to interact with insights.
3) Creative
Users may communicate difficult data findings in an engrossing and appealing way by using creativity in data storytelling. Users may make data stories more readable and digestible by paying attention to the layout, colour palette, and other design components. Today’s BI platforms provide users with a variety of tools and components that encourage creativity in the delivery of information.
4) Data management
Even if we can have a fantastic data story in hand, it’s crucial to guarantee the accuracy of the data that is provided. Modern BI platforms can effectively collect, manage, and use data thanks to the framework provided by data governance. Users can also specify precise access rules to control who can and cannot utilise the insights. In later posts on this blog, we’ll take a closer look at this.
Modern BI tools’ primary data storytelling enablers
Data storytelling will continue to play an increasingly significant role in helping businesses get value from data as data becomes more pervasive. In order to meet current demands, BI platforms are starting to include native data storytelling capabilities in BI workflows.
Here are a few quickly developing data storytelling tools in the BI space:
1) Presentations
With the help of interesting visual aids, presentations are an effective tool for business communication. Users may easily include dynamic data insights into their daily presentations thanks to the comprehensive presentation features that are currently provided by BI platforms. This eliminates a lot of the labour-intensive tasks, such as copying iframes, embedding code, and other tasks.
In the demonstration video down below, we briefly go over how to make presentations within Zoho Analytics, add various presentation builder creative features, set up access controls, and much more.
2) Analytics web portals
Another excellent method of disseminating and consuming insights is through purpose-built analytics portals. Analytics portals enable the self-explanatory presentation of data stories so that users may safely access them. These portals can include a number of tabs, embedded movies, iframes, maps, photos, or any other media files, as well as a variety of creative components that make data stories interesting and captivating.
You can see some of the main features of an analytics portal created with Zoho Analytics in the demonstration video below.
Conclusion
Given the widespread use of BI and data analytics, it is critical for BI users to develop and provide immersive data stories because they are now so important for decision-making. To create powerful data tales, follow these 4 principles of data storytelling.
Modern BI platforms are moving closer to a new milestone in data storytelling by adding tools that put this concept into practice.